About
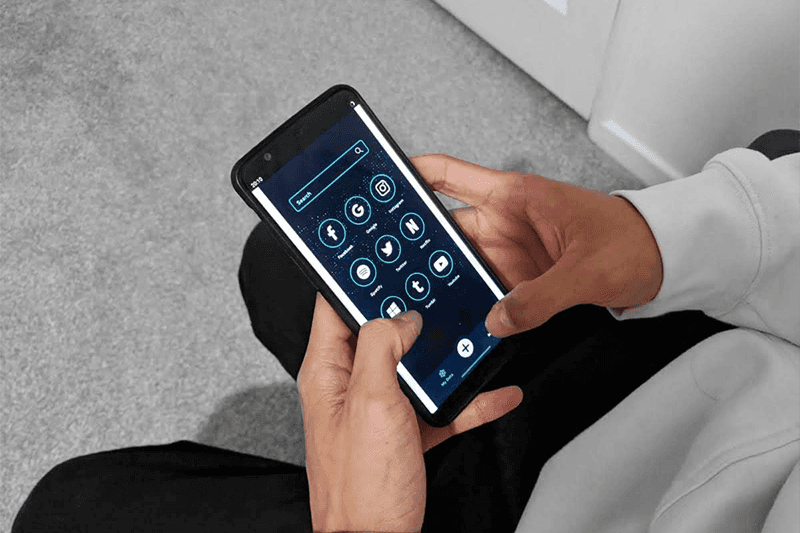
Frank is a mobile app that utilises the characteristics of personal data and affordances of psychological possessions to give users a greater sense of ownership of their personal data and recognise its value.
BACKGROUND
The desire among UK consumers for control over data collection and usage remains entrenched in 2017, with 86% agreement. 71% of 18-24 year-olds seek more control over the flow of their data (DMA Group, 2018). Such high percentages reveal a demand and a gap in the market for a service to help users meet their needs. The proportion of consumers who feel that they have a lack of control over preventing companies from collecting information about them has increased from 56% in 2015 to 65% in 2017 (DMA Group, 2018).
These discoveries underscore the significance of providing people with an increased sense of control and ownership over their personal information in order to develop a healthy and trustworthy data culture in the UK.
Before choosing the research methods, the question of “what are you trying to find out?” was proposed.
What is the current routine for users managing their data?
What do users value and how much do they care?
What are the barriers that hinder users and where is this rooted?
How do users perceive their personal data? Do they see value?
How do users feel about the existing experience of controlling their data?
What is the desired experience for managing user's data?
Designing the right methods is crucial to collecting the right data.
Choosing what research methods to use was extremely difficult. User's data is a personal subject, recording and conducting research requires delicate consideration of ethics. Recording user’s behaviour directly is hard to do without being too invasive of the user's personal life.
When asking users about how they felt about their experience with managing their data and privacy, a lot of the participants didn’t even think about the surrounding subject before, so the responses were often neutral. To draw out their emotions, I designed activities like the Card Sort to spark emotional responses.
Interviews
Semi-structured interviews were the starting point of my research. They were used to find out users’ values and feelings. The interviews were conducted in person so that nuances of personal expression and body language are recognised during the session.
Semi-structured interviews created a less formal atmosphere, allowing for discussions with detours to appropriate topics opposed to a fixed routine of questions.
Each session was recorded to capture all the details from the participant. This also allowed for clarification later when data was being processed for analysis.
Work book
To understand how much people knew about how to control their data, a workbook was designed. Dummy accounts were provided to keep all of the user's information protected.
The workbook involved a variety of tasks to assess their knowledge thoroughly. A free space was also provided that allowed users to illustrate any points they wished.
After each task, participants were asked a series of questions to gather their thoughts and feelings while they were completing the task.
Card sort
To understand how users perceive and manage data privacy, an activity was created that prompts users to reveal what they think they know. This involved participants outlining what they thought a specific app had access to and didn’t have access to (e.g. camera/calendar/storage), what the company knows and doesn’t know (e.g. age/interests/location), and lastly sorting a list of personal information into who can see what (everyone/mutuals/only me).
After each card sorting activity, participants would then check their device and app permissions to reveal how much of what they think they know was correct. At this point, it revealed to the researcher and the participants their expectations against reality. This sparked an emotional response and to capture this, a series of follow-up questions were asked.
Auto-ethnography
To explore the experience of handling my data first-hand, I conducted some basic tasks myself in context to understand what and how users feel. Screenshots and notes was used to document my experience, capturing my thoughts and feelings throughout.
This was one of the first methods I conducted as it helps understand users, prior to conducting research methods. Auto-ethnography allowed for empathy towards the users and helped design the research methods going forward.
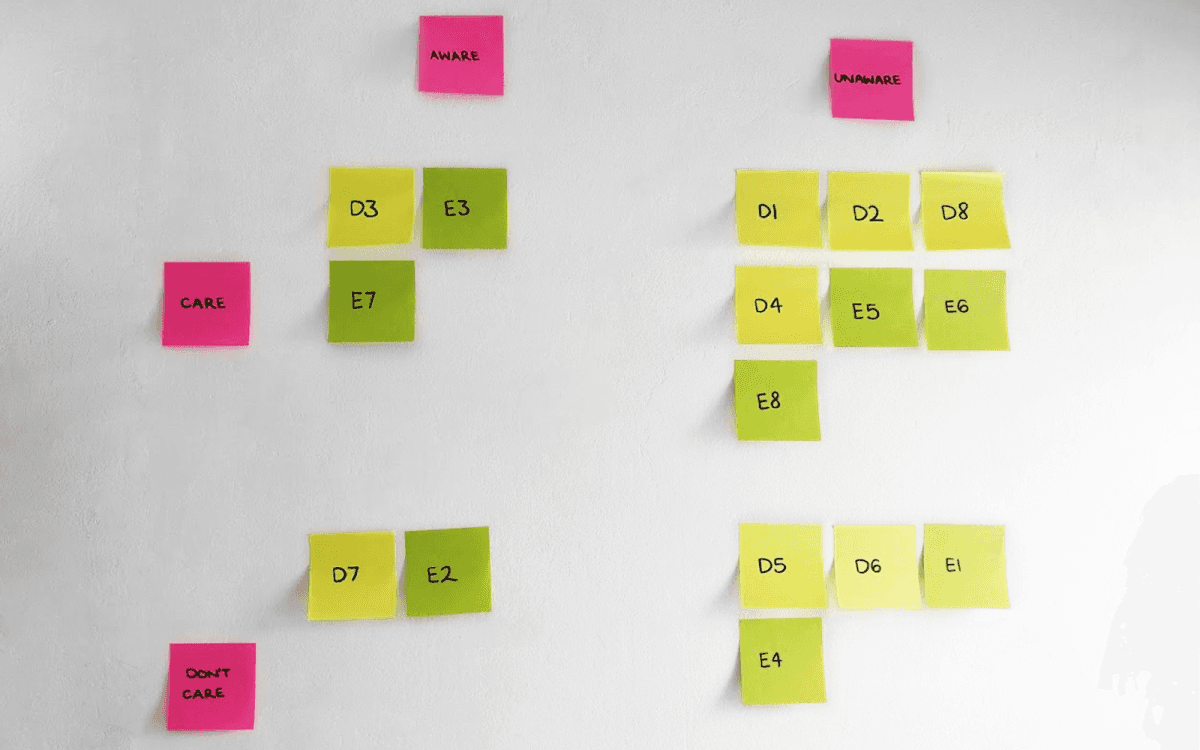
Once all of the research was complete, the participants were categorised into one of the four categories
Participants were categorised as Care/Don’t Care by the responses given in any of the research methods carried out. They were categorised as Aware if the user knew all of the following:
I. How to control their privacy level
II. How to check what a company know of you
III. What companies can do with their data and how to manage this
The research methods were designed to draw out these aspects so that they could easily be categorised. This operation of categorisation was performed so that the general target audience could be narrowed down further in order to efficiently cater to a more specific set of needs. The original target audience of students in general have very different characteristics as seen from the four categories identified above; each of the users in these categories have different behaviours and needs, therefore designing a solution for a wider general audience will potentially end up tackling too many problems opposed to creating a stronger and meaningful solution for a specific, well-defined set of users.
Affinity diagram
After deciding on which type of users were going to be the focus, an affinity diagram exercise was carried out. This involved writing down every data that was collected from all the research methods, grouping and analysing them based on similarities or themes to identify the underlying significance.
The first round of grouping was general and loose connections. The second and third round categorised the data in more concise groups.
As groups became more distinct, labels were added for clear classification. This can lead to thinking inventively and making non-traditional connections that aren’t visible at surface level.
Affinity diagramming was conducted after homing in on one type of user so that time wasn’t spent analysing participants that no longer aligned with the project’s goal.
As a result of the primary research conducted and analysis of the data through affinity mapping, numerous key themes emerged.
Trust in a Company
People trust companies with their data if they are trusted by others. This relies on users trusting other users which can lead to a false sense of trustworthiness. For example, user A trusts a site because user B trusts the site; however, user B only trusts the site because user A trusts the site. This perpetual cycle of trust isn’t based on any experience or facts, but rather reliance on others. This statement also applies to users that only trust a company if they are well-known or regulated by the government.
Transparency
The more transparent a company is with what they do with user’s data, the more trustworthy the company is perceived to be. Users wanted transparency of how their data is being used and free control of their data; however, none of the participants read the terms and conditions or privacy policies.
Inconsistency
The level of knowledge of how to control your data and privacy differs drastically across different social platforms. Users that are highly experienced with control of their data on Facebook, may not necessary be applicable on Twitter. This shows that regardless of your level of knowledge and familiarity with technology, it doesn’t transfer across platforms.
Personalisation
The aspect of personalisation of an experience is welcomed. Users are willing to provide companies permission to use their data in return for benefits however, some users are unaware of the fact that allowing companies of certain permissions can benefit them. Regardless, all participants in category B appreciated personalisation of a service which included saved preferences and personalised ads.
Early stages of change
People care about their data privacy but don’t know how to manage it. They care but not enough to take action. This is down to multiple factors, mainly lack of knowledge. Users aren’t fully aware of both the drawbacks and benefits. Conflict of interest also stops them from a potential behaviour change.
No Knowledge of Rights
Users lack the knowledge of their rights towards their data. This contributes to the lack of push and motivation to manage their data. If users aren’t aware of what they’re entitled to, they’re less likely to push agendas.
Insights
Findings are produced from the research carried out and tell us the ‘what’, however findings alone don’t tell us the ‘why’. After several iterations of research and questioning ‘why’, insights began to emerge that addressed the heart of the problem. Insights pave way to ideas that provide a potential solution to the target user’s problems.
Value of Data
People don’t know the value and significance of their own personal data. Most users are only aware of the drawbacks of providing their information to companies, therefore giving permissions of personal data companies often has a negative connotation. On the other hand, some users don’t see how their personal data benefits companies which also causes the lack of appreciation. If users were more exposed to all of the advantages their data can have, to both the user and companies, it can give the user empowerment.
Disconnect
There is a disconnect between what users provide to companies and the implications of such actions. Users expressed even when they have the knowledge of how to manage their data, they aren’t fully aware of the implications. This dissociation is caused by multiple factors. The information where you can find all the details is usually hidden and requires users to actively search for it. When the information is readily available, it is described by users as hard to read, too much technical jargon and tedious. One of the main catalysts for users not realising the value of their data is because of this disconnect.
Sense of ownership
As users don’t feel they have complete control, it can be hard to feel a full sense of ownership of their own data. Even if there are features for managing and controlling their data, they still lack the sense of ownership. Obtaining this ‘sense’ of ownership varies depending on the user. Some users feel a sense of ownership the more control they have over their data, whereas others that already have control, knowledge is what fulfils their sense of ownership. It is only when users have both full control and are aware of the benefits of their personal data to all parties, can users feel like they own and control their personal data. Once users feel this ownership and see their personal data as an asset, users can truly appreciate the value.
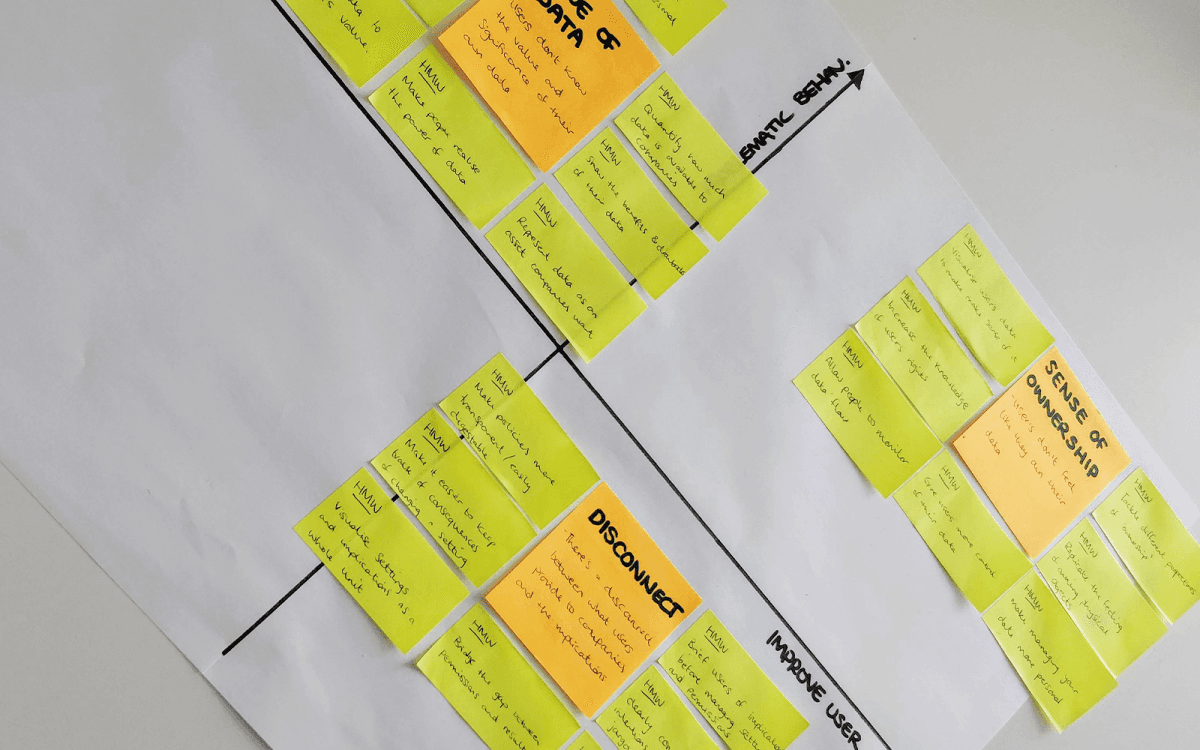
Insights were explored further with How Might We opportunity statements.
How might we:
Visualise user’s data to make sense of it and represent its value
Allow people to monitor their data flow
Give user’s more control of their data
Tackle different perspectives on what it means to have ownership
Replicate the feeling of owning physical objects for data
Make managing your data more personal
Make policies more transparent and easily digestible
Keep track of short term and long term effects of settings
Build emotional connection to personal data
Quantify the amount of data that is provided to companies by users
The key insights were mapped onto an evaluation matrix with the 2 axes: Problematic Behaviour and Improve User Experience. This was to order the insights in a systematic way so that the HMWs could be prioritised.
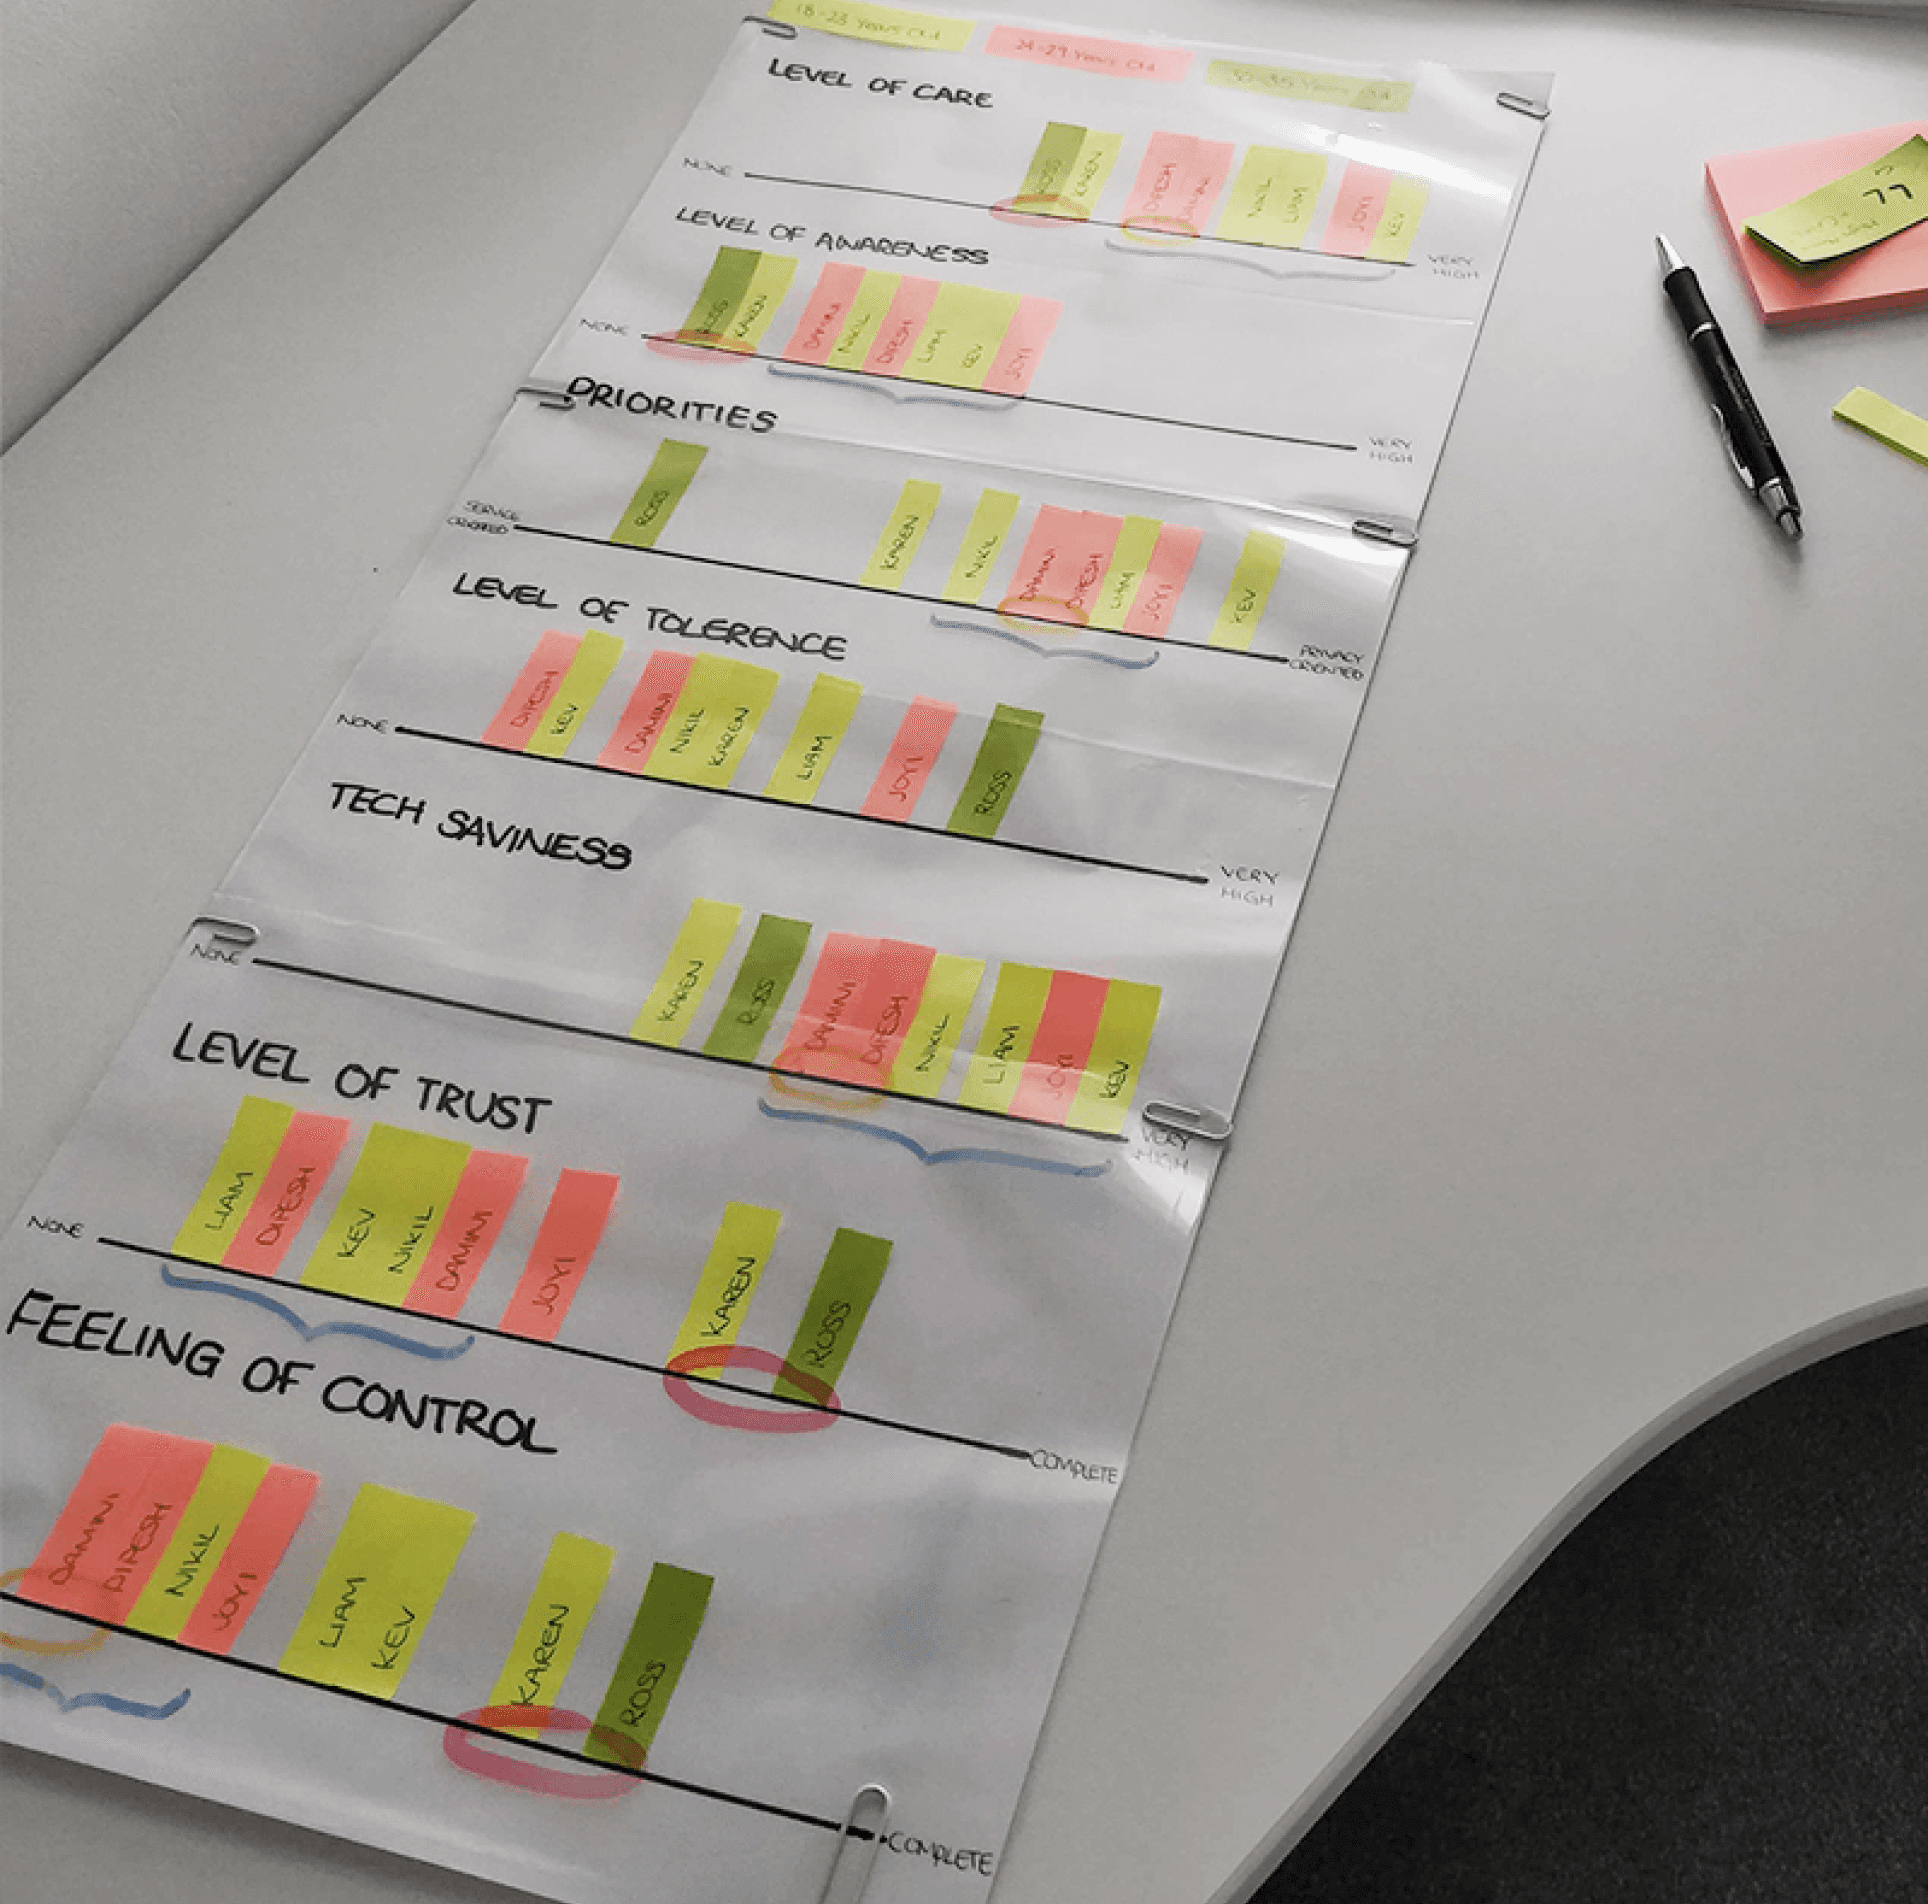
Persona Building
The method used to build a persona was Kim Goodwin’s method. This method is directly created from the research conducted and was specifically chosen as it highlights key areas where participants cluster along various variables.
It was important to know people’s attitudes, behaviours and motivations on specific topics to reveal all the intricacies of the users. As the method clusters participants, it allows for patterns to be identified and explain other potential patterns. Following this, characters are able to be developed using the attitudes, behaviours and patterns identified.
Although Goodwin’s method has many advantages, it also comes with its drawbacks. It heavily relies on the judgement of the research on where participant maps onto the variable scales therefore is subject to bias. Creating patterns and the explanations for patterns is also not an exact science.
Problematic Characteristics of Personal Data
Deep understanding of a target facilitates not only the experience of ownership itself, but also fosters ownership attributions.
Intangibility
The most obvious characteristic of personal data is its intangibility. This refers to the inability to touch it or lacking a physical presence. This makes it increasingly more difficult to experience control.
Invisibility
In its rawest form, data is fundamentally information that is represented as numbers and figures. Most of which user’s do not see and/or comprehend. From the user’s point of view, this information is invisible. While intangibility restricts users from interactions, data’s invisibility can prevent users from the desire to interact with data to begin with.
Complexity
An added layer to data’s already problematic characteristics is how complex it can be. Even if data was tangible or visible, it is not clear whether users can comprehend and use the data that is present.
In-evaluable
Users not only have to be aware and comprehend their data, they also need to be interested in it. Evidence suggests that consumers are fundamentally uncertain as to how valuable their personal data actually are. We aspire ownership over targets which are attractive or meaningful; unless data can obtain additional value, they are unlikely to become coveted psychological possessions.
Others will be attempting to fulfil the same user experience. Conducting competitor analysis allows you to scope out the competition.
After defining the scope of the project, the first step of the activity was to set a criterion for the list of competitors so that the comparisons were meaningful. The criteria as to who were considered as competitors were either of the following:
A. In respect of data privacy
B. In respect of data policies
C. In respect of data management
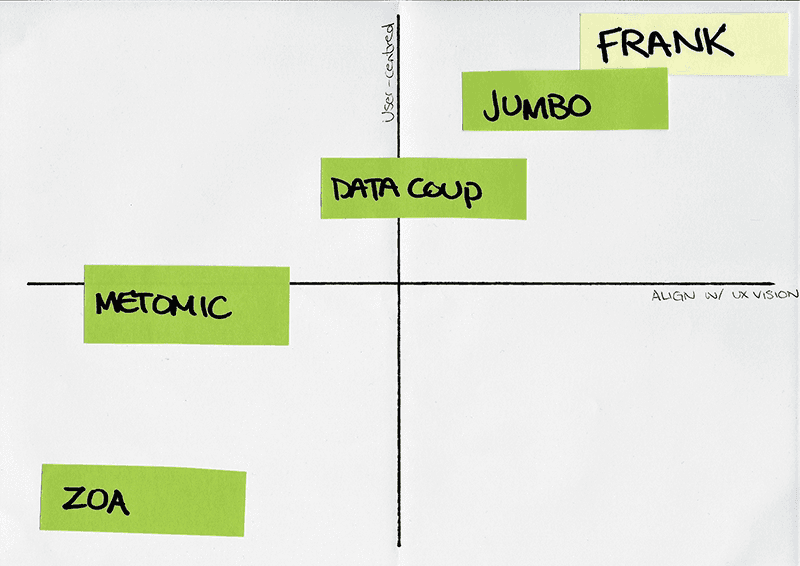
Once the list of competitors was established, research was conducted by viewing their website and trying their product/service. A table was created to document what they do, their strengths, and weaknesses so that an objective comparison could be made. A summary of opportunities was then created to help shape my concept.Mapping all the competitors on an evaluation matrix allowed a comparison of where the potential concept would stand against its competitors. The two axis of the matrix includes ‘User-Centered’ on the y-axis and ‘Align with UX Vision’ on the x-axis.

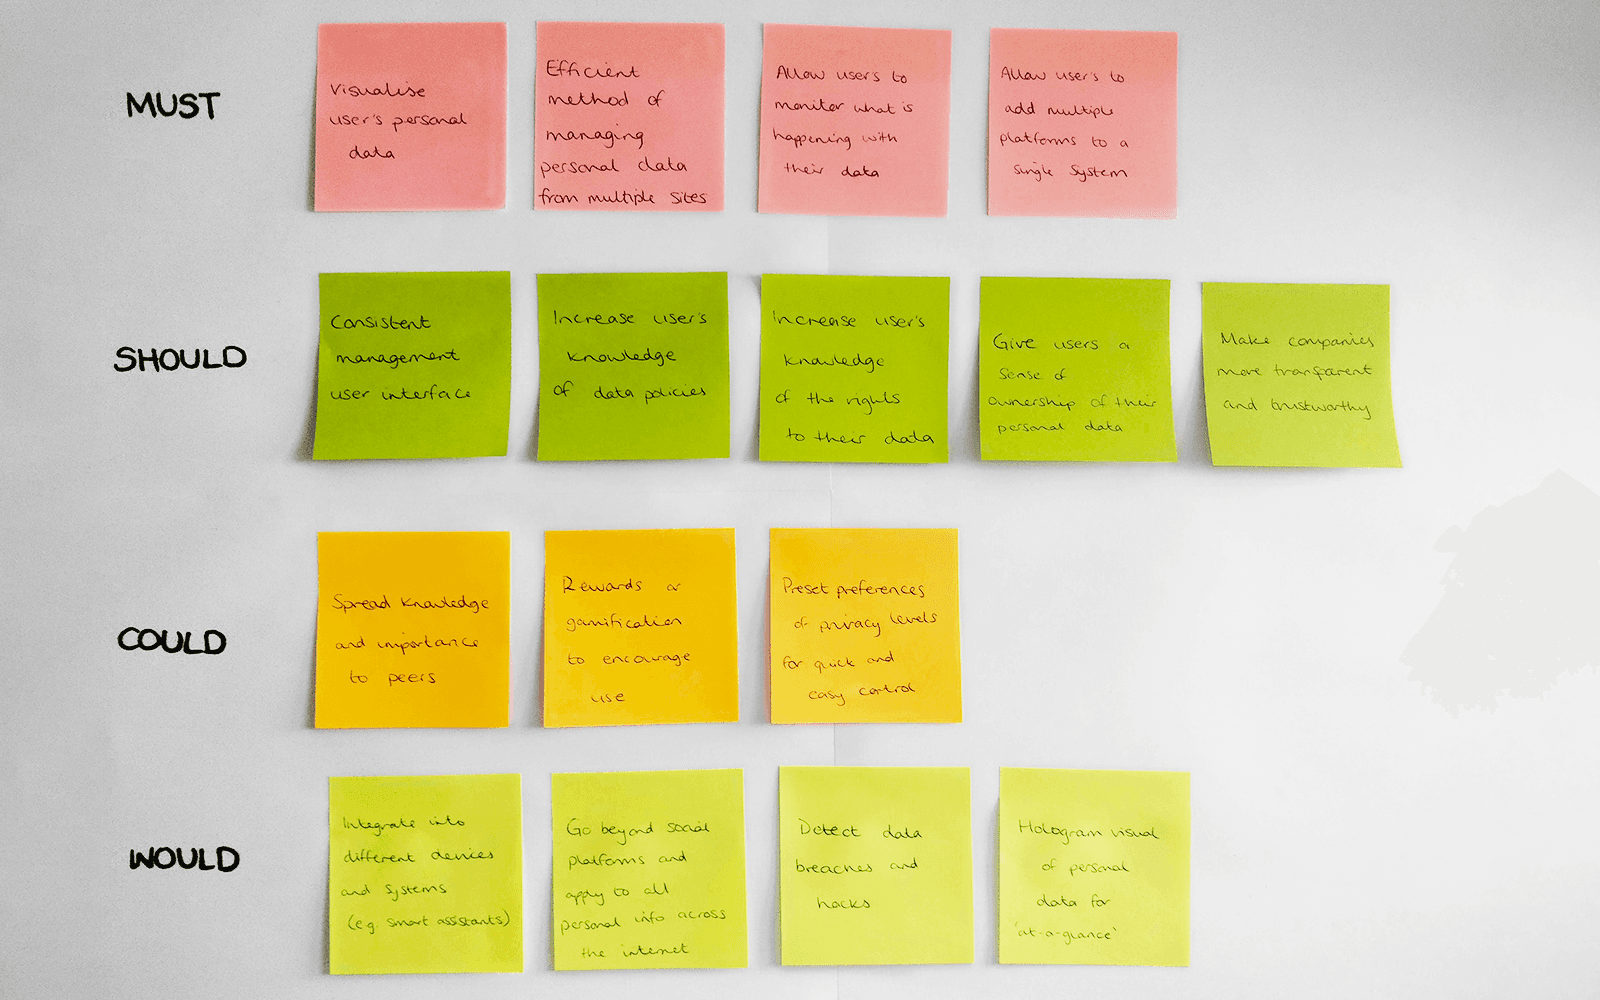
MoSCoW was used as a prioritisation technique for concept requirements.
MoSCow good for clarifying the priorities involved in the project and also set the parameters of what will and won’t be done. It breaks down the concept requirements into four categories, Must have, Should have, Could have and Won’t have.
Must
Visualise user’s personal data
Efficient method of managing personal data from multiple platforms
Allow users to monitor what is happening with their data
Allow users to add multiple platforms to a single system
Should
Consistent management user interface
Increase user’s knowledge of data policies
Give user’s a sense of ownership of their personal data
Makes companies more transparent and trustworthy
Could
Spread knowledge and importance of personal data
Rewards or gamification to encourage use
Preset preferences of privacy levels for quick control
Voice narration and control
Won’t
Integrate into different devices and systems (e.g. smart assistants)
Go beyond social platforms and apply to all personal information
Detect data breaches and hacks
Hologram visual of personal data for glanceable information
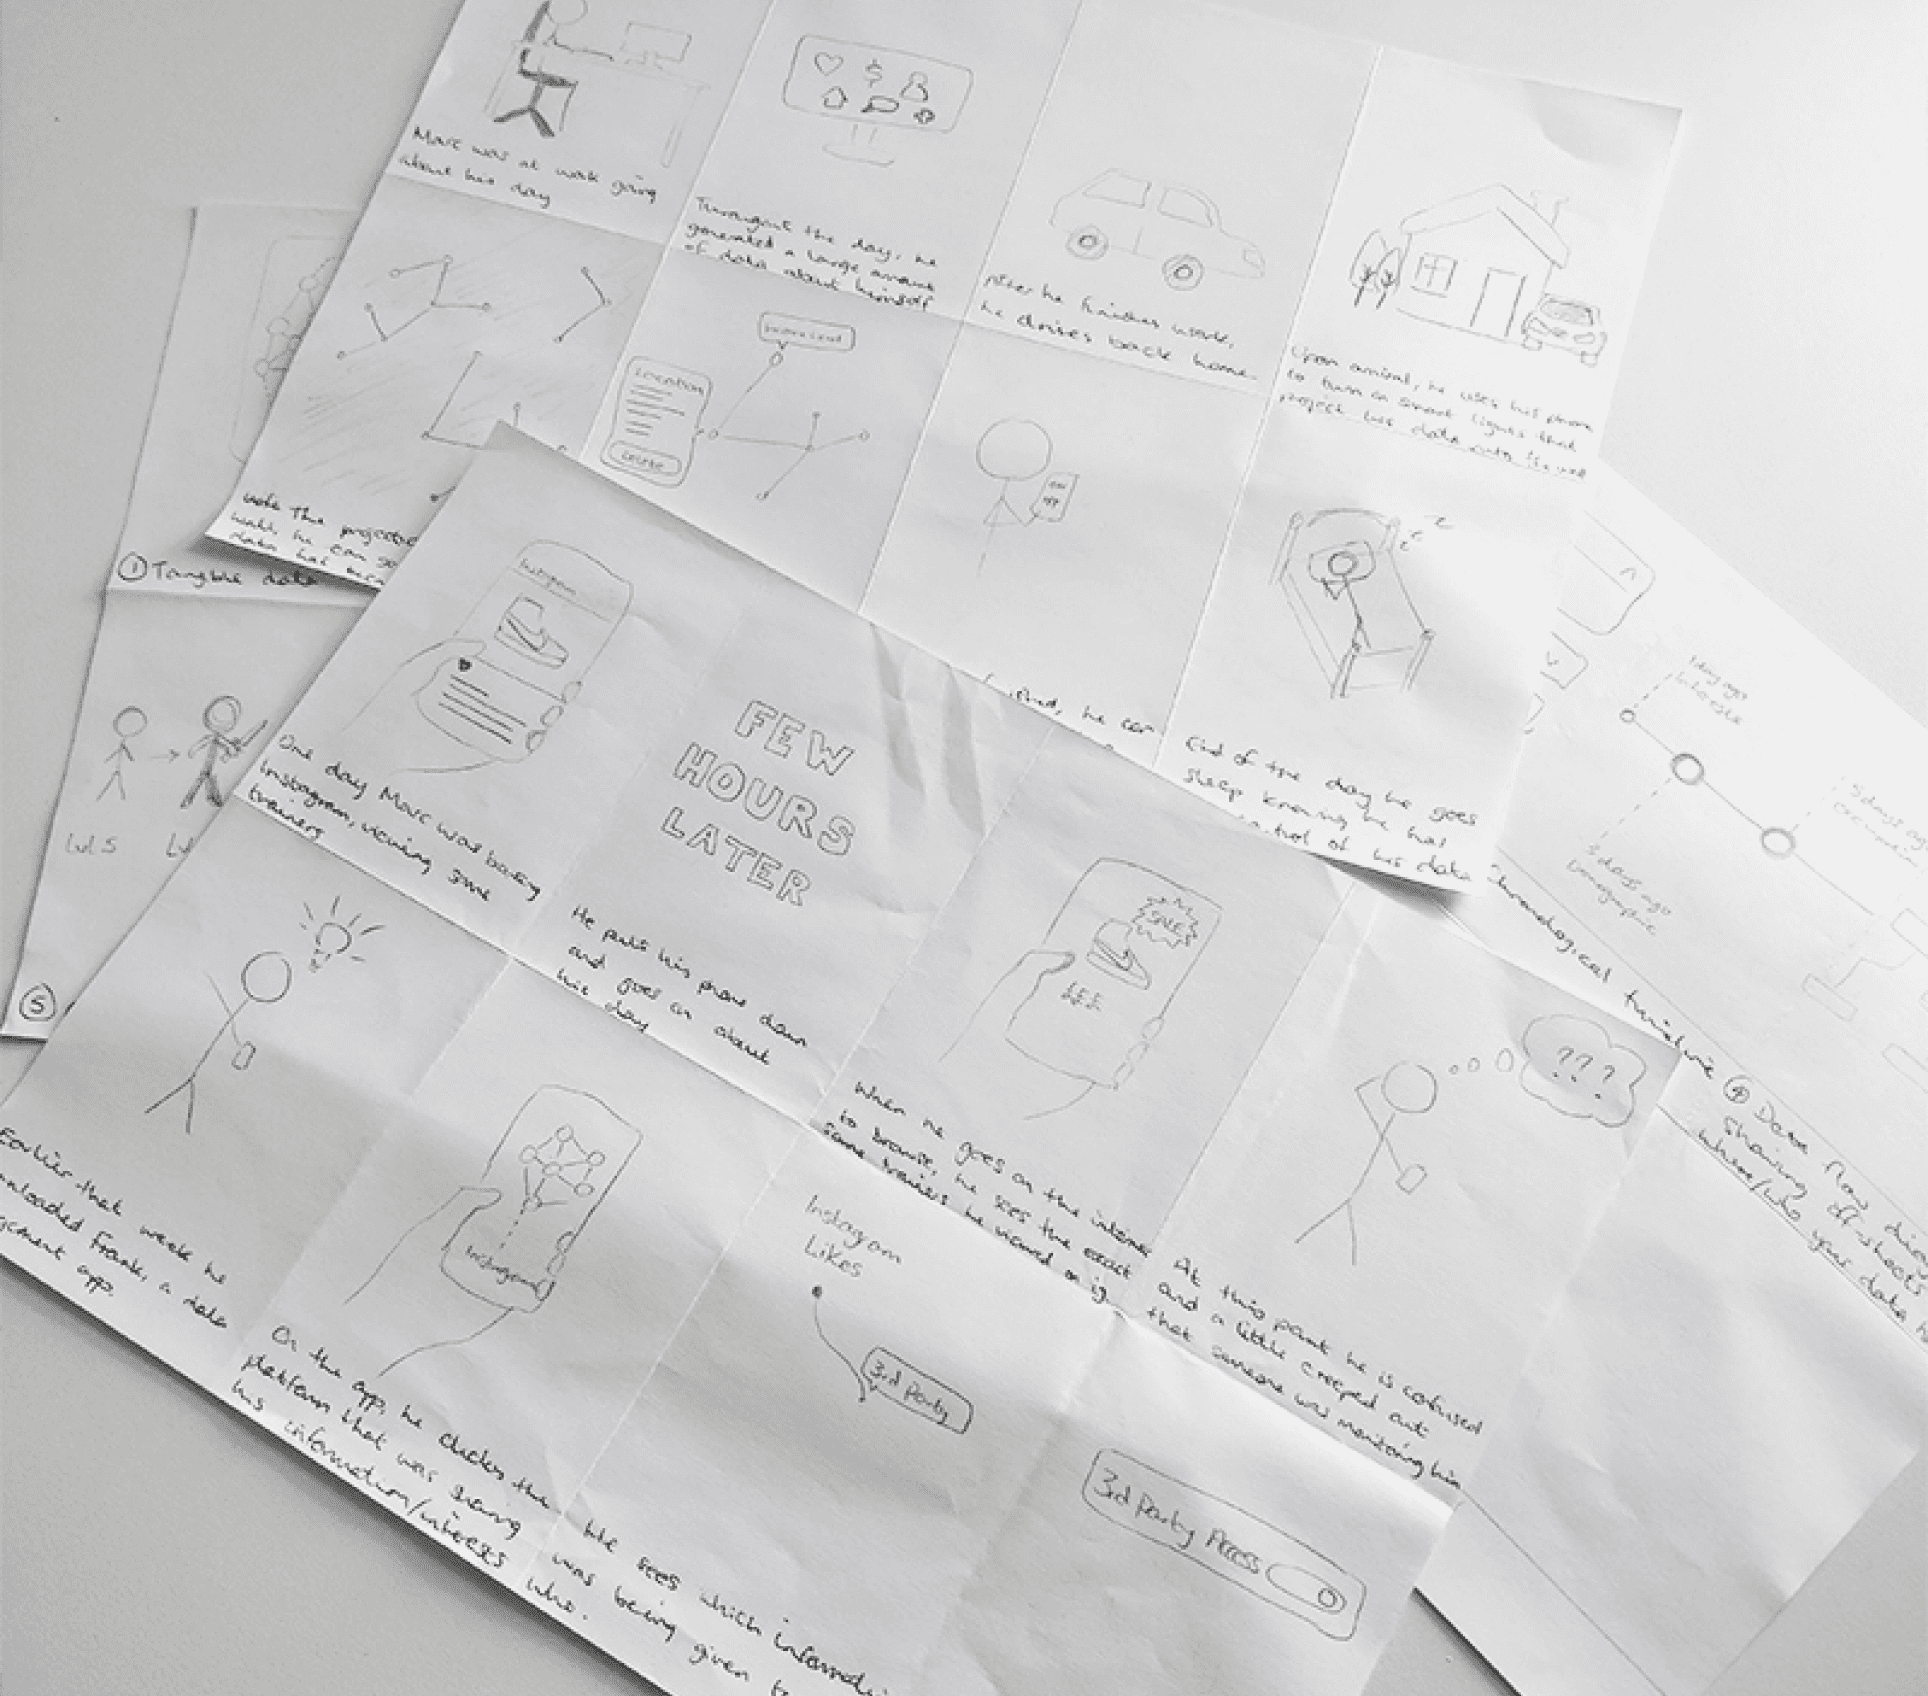
For each ‘Must’ requirement, context scenarios were created in the form of a storyboard.
Context scenarios highlight the most important areas to focus on, which areas need additional help and reveal the main needs and motivations of the users, empathising with them. These scenarios were later brought into a bodystorming exercise to test them in context so that they could be refined iteratively.
Bodystorming was used as a form of experience prototyping to validate and improve the concept going forward.
A combination of role-playing and simulation in a physical environment helps understand how to convey the intended experience to the target users in the best way.
Prior to conducting the exercise, users were shown the context scenarios beforehand to allow them to understand the story being told and to gather their initial feedback and suggest improvements.
It was found that although there was an embodiment of their personal data, the lack of interactiveness with the data itself, left the user with little to no sense of ownership over their data.

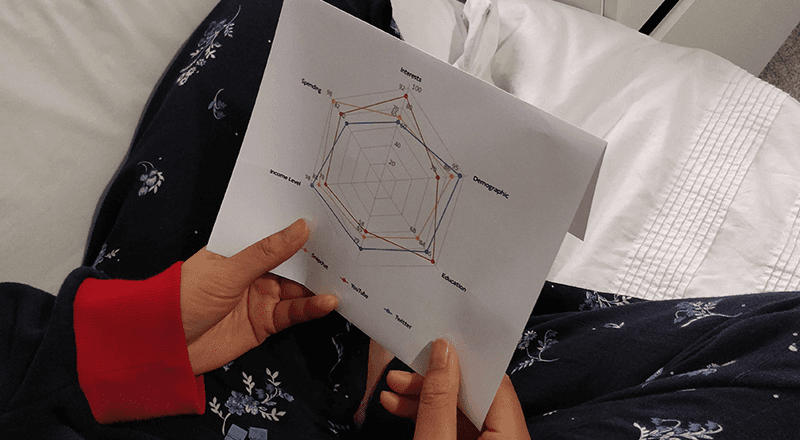
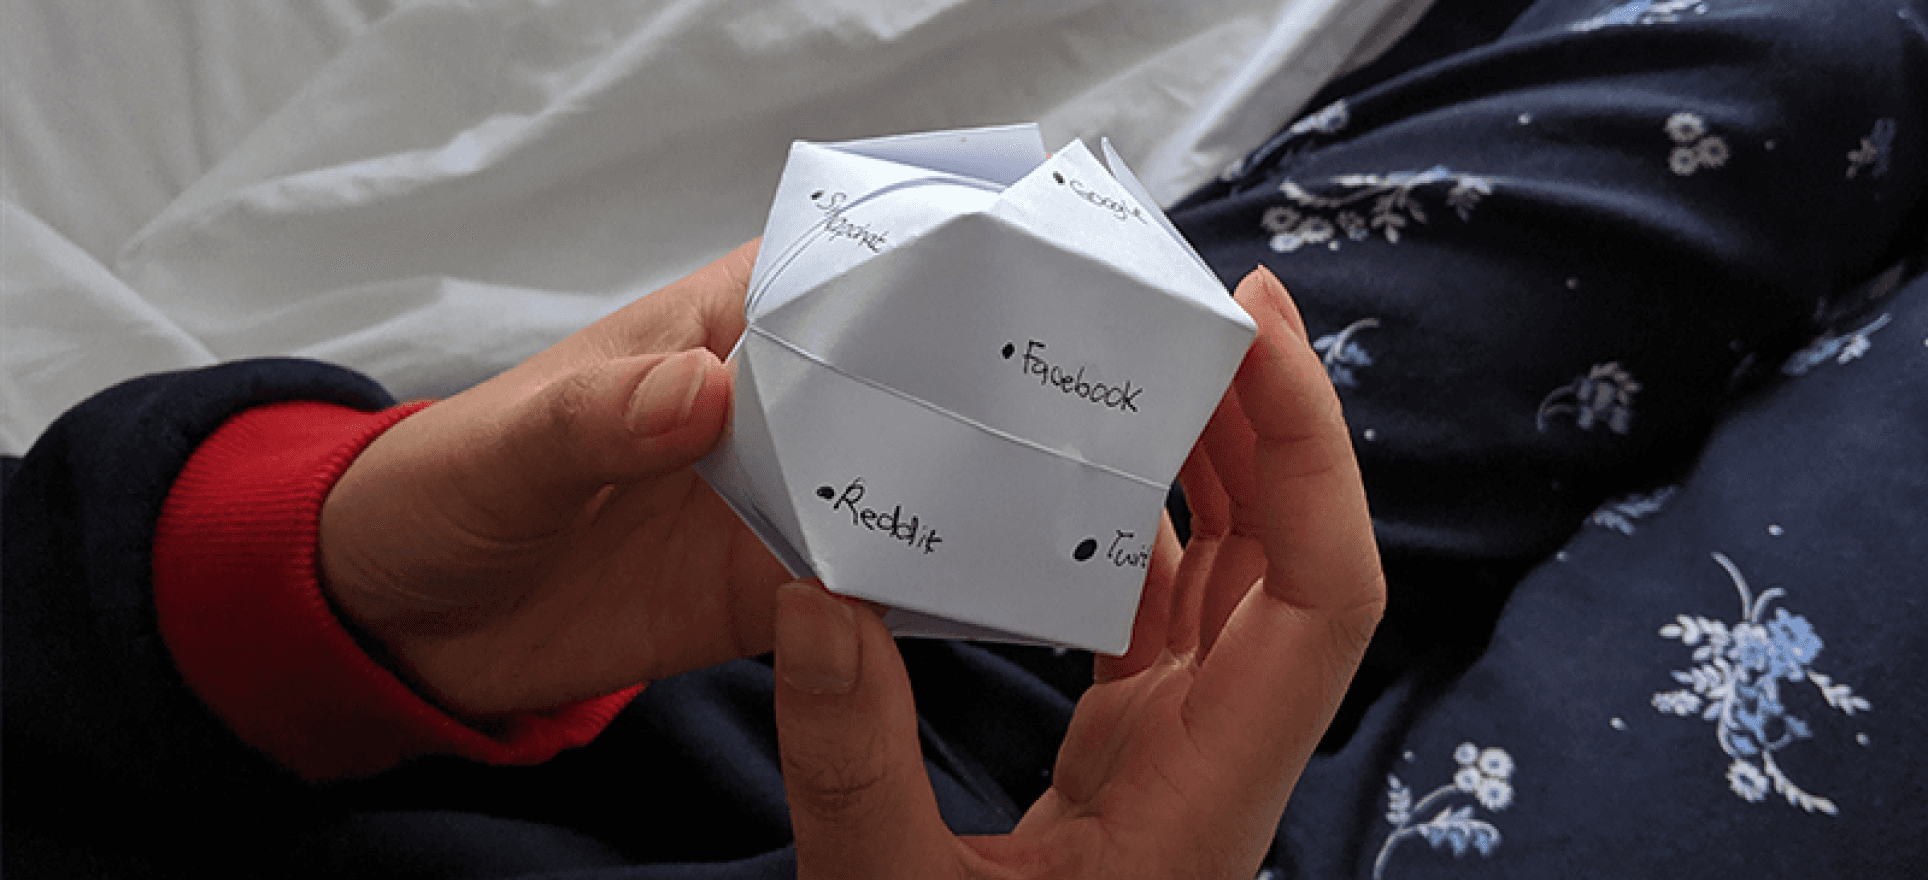
On the second iteration, a 3D model of the user's data was created. This helped replicate the feeling of a tangible object. Although this wasn't the intended design outcome, it confirmed whether or not having the attributes of a tangible object increased their sense of ownership of their personal data.
Given the feedback that was provided, a co-design session was conducted. Implementing improvements and working on the concept further in regards to new/existing features and the user experience.

Improving perceived control and ownership of personal data.
Upon deciding which concept would be taken forward, the abstract concept of user’s data needed to be worked on to achieve a full sense of ownership. In the book of Psychological Ownership and Consumer Behaviour, Baxter et al. (2015) identifies five abstract properties that convey perception of control:
Spatial control
The experience of physically manipulating a given target. With an intangible asset such as data, this can be difficult without first constructing an abstract form of data that can be physically manipulated.
Configuration Control
The ability to alter the settings of the target. Out of the five abstract properties that convey the perception of control, this is the easiest to implement as you are already able to do this through any given platform such as changing who can see your personal data.
Temporal Control
The ability to use the target when desired. The ability to achieve this control is situational due to some data being immediately available such as your interests, whereas other data is not immediately usable when desired such as your credit score.
Transformation Control
The ability to alter a target. Given that data is intangible, it defies the conventional transforms. Baxter et al. (2015) state there are two ways to transform data, the first one is configuring them or by first visualising the data or making it tangible.
Rate Control
The ability to adjust the amount that is being consumed. This is difficult from the user’s point of view if they aren’t completely aware of all the data that is available. An aspect where users can manage the rate of control is when managing who can see what data of theirs.
Lo-fi Prototype Tests
To test the fundamental usability and the flow of the app, lo-fi prototype tests were conducted with participants. The initial lo-fi prototype testing was through paper prototypes which was then uploaded to Marvel App for a more realistic simulation. This form of rapid prototyping allowed improvements to be made without committing to a concept.

Hi-fi Prototype Tests
After iterating and implementing improvements from the lo-fi prototype, a high fidelity prototype was created. The hi-fi prototype consisted draft colour schemes and branding which enhanced the overall experience of the app. It allows for specific components and small details to be tested.